
Finance Revenue Charts
🎬 🍿 Watch our Product Feature tour to learn more
Finance Charts are an Advanced Module
From the Main Menu | Finance | Charts, a range of revenue charts are available.
These charts are for both Bookings and Departures, Released and Un-released Departures
There are display controls for displaying Revenue, based on the season/s, Trail (inc All Trails option), Method of Booking... so you can filter out and view the sales from Agents, Direct, Operator etc. (and combinations of these)
You can compare 3 years of data at a time by select a specific year, then see the data for the year prior & the year ahead
And you can see how your Bookings are TRENDING based on the date the bookings were placed by your clients, (as opposed to the travel date of their Trip)

How to use the Finance Revenue Charts
First, make your data selections, and refresh the chart
- Select a single trail from the drop down list
- Select a season from the drop down list
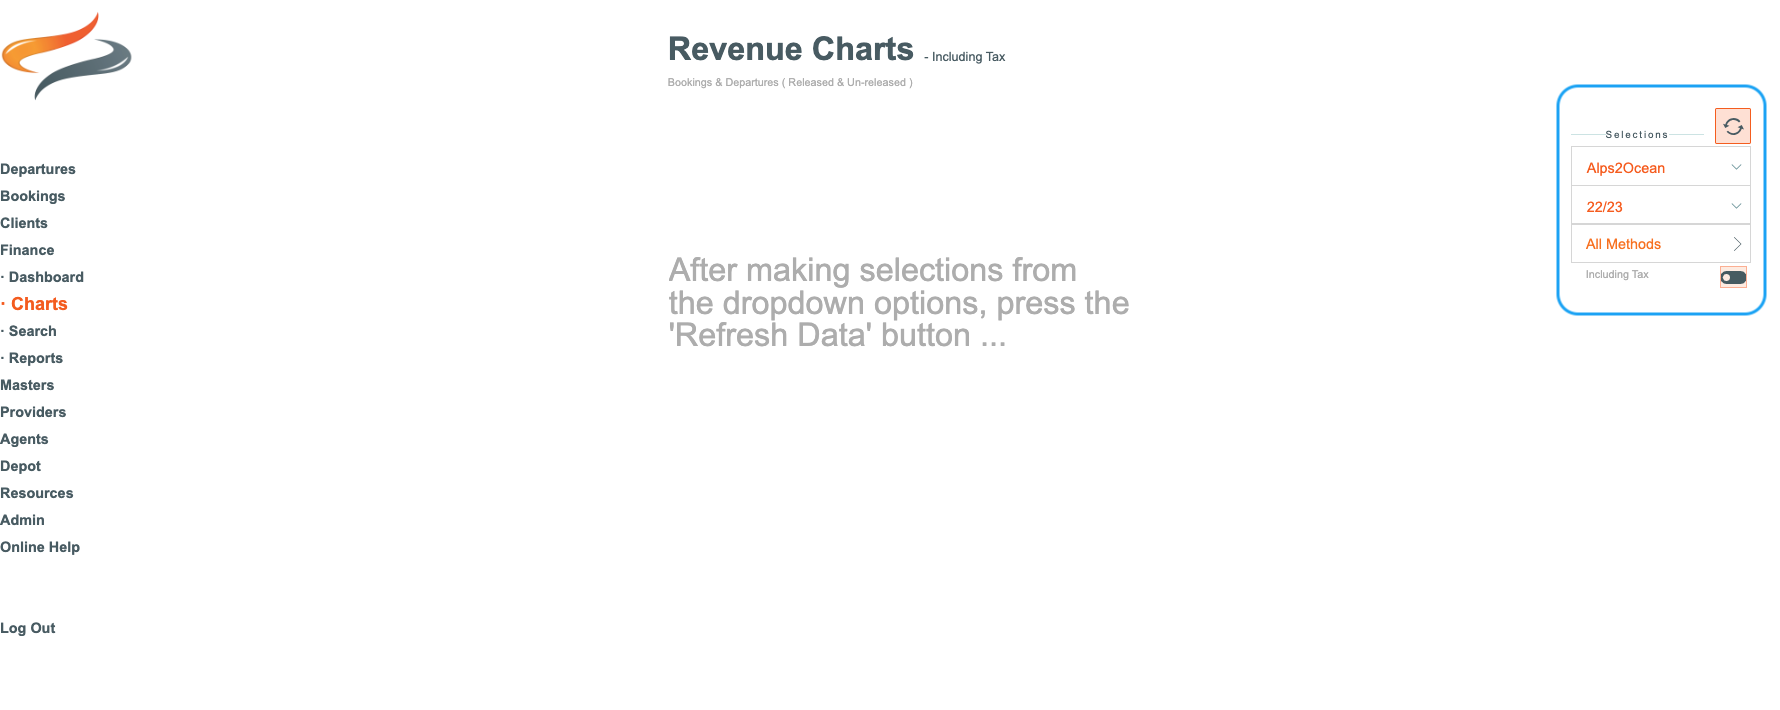
- Select the method the booking came to you from the Method drop down list (direct, agent, etc). Note that you can make multiple method selections, and these will be detailed in the resulting chart
- Specify including or excluding GST by using the slider button

- and then click the refresh button

Second, choose any display options

The top set of Display options control the choices for a SINGLE TRAIL
- You can select a single year
- Or three years comparison (the chart will show one season either side of the currently selected season),
- or Click Booking Trends if you wish the chart style to change to a cumulative line chart, for 3 comparative seasons

This chart includes the total number of clients per month on this selected trail,
and the total number of clients for the selected year


The second set of Display options control the choices for ALL TRAILS
- You can select a single year
- Or three years comparison of all trails (the chart will show one season either side of the currently selected season)
- or Click Booking Trends if you wish the chart style to change to a cumulative line chart, for 3 comparative seasons

This chart includes the total number of clients per month on all trails,
and the total number of clients for the selected year

