
Pivot Tables - 2 month - PAX Run Info
This Pivot table will give you 61 days (approx 2 months) worth of PAX shuttle quantities starting from the date Display Date entered.
It will use the 'Process all Trails' tick box, or if not ticked, the chosen Trail will be used.
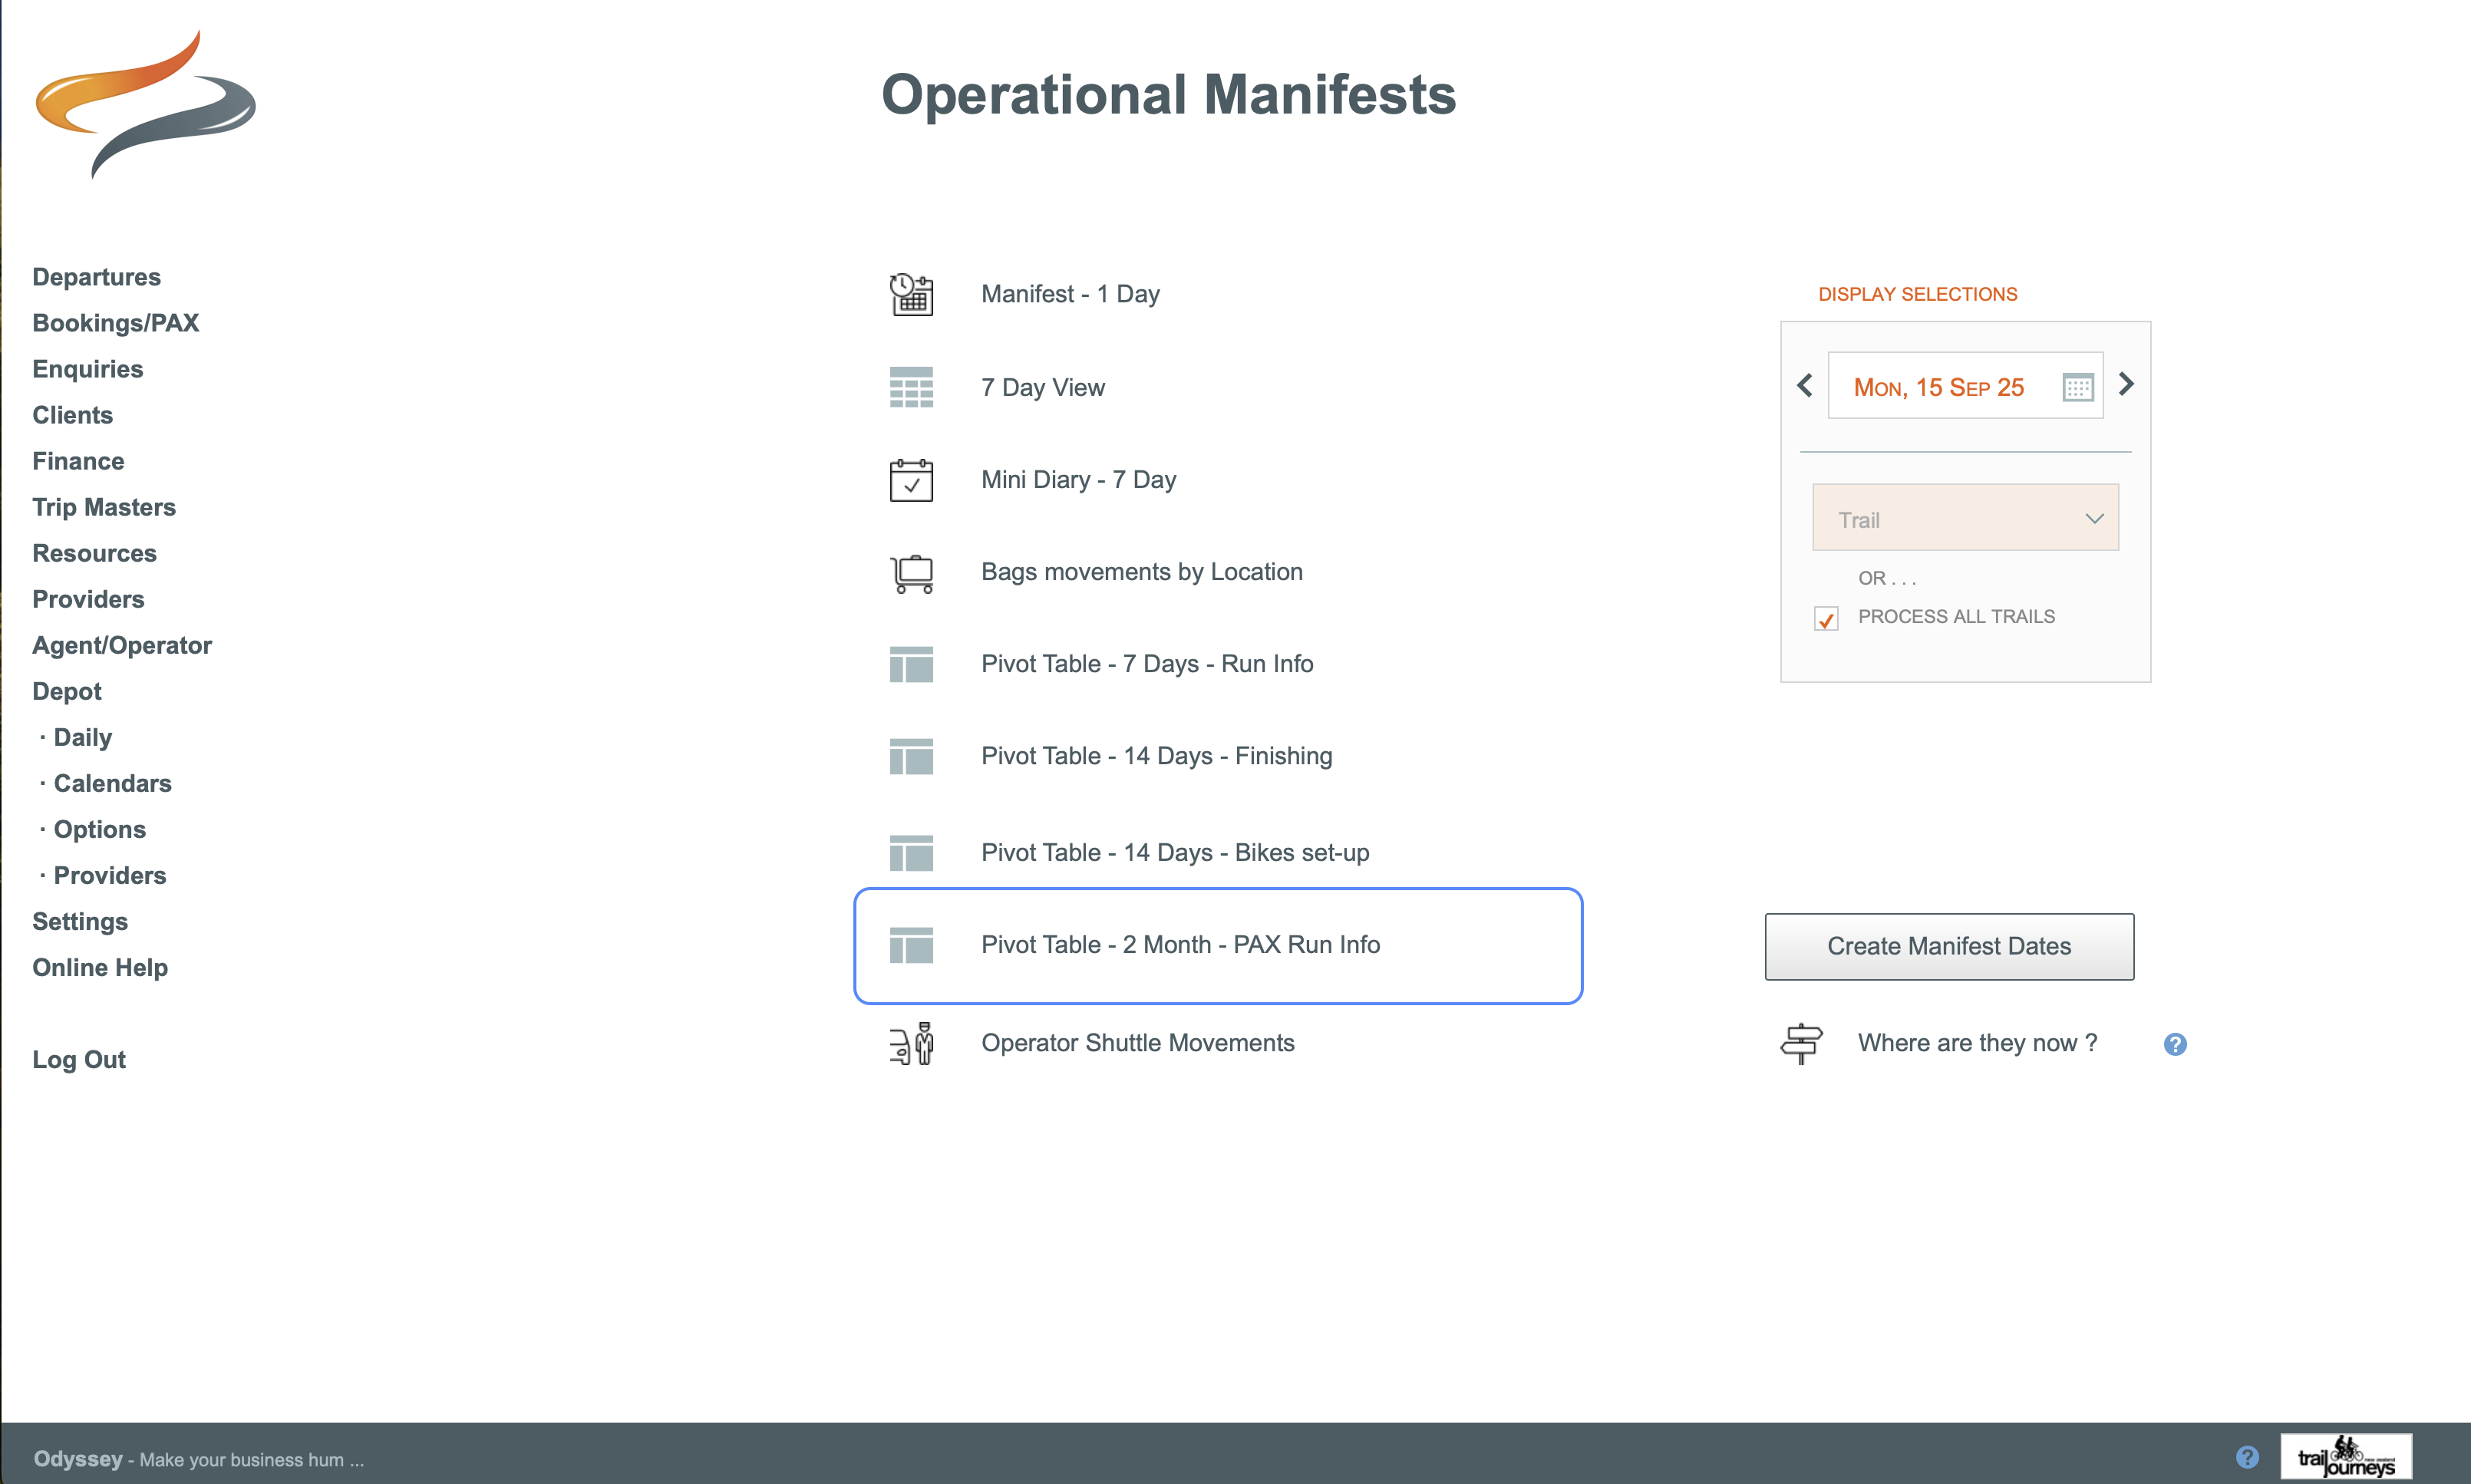
From the Main Menu | Depot
- select the trail or "all trails" you want to report on, and the starting date
- then select Pivot Table - 2 month - PAX Run info
- select run name and drag it to the x (top) axis
- select date and drag it to the y (left) axis
- Released /Not released + the Booking Status options are all available to make selections with... meaning is vital you choose what you are wishing to include in your totals, or exclude.
Don't assume these are all just 'confirmed' & released... they are all records, and you need to filter based on your need.

Using the heat map function is a brilliant way to highlight the peaks and lows of data, so that you can focus on them. This is using exactly the same data, but using the heat map function, to present the data differently.
