
AI reporting
Odyssey's AI reporting tool eliminates the guesswork from running your tour business. AI reporting uses artificial intelligence to automate data gathering, process complex numbers, and generate plain-language insights or visual dashboards. The primary benefits include massive time savings, simpler data interactions through everyday language, and the ability to spot hidden patterns or anomalies instantly.
To use AI reporting
- From the Main menu | AI reporting

Ask a Question
Odyssey's AI reporting tool allows you to type you own query directly into the question field; it will automatically interpret your request and report from your data. Using your own terminology!

- From the Main Menu | AI Reporting | Ask a Question tab
- type your own question, in your own words, into the question field

- Press the Ask button

- The results of your query are shown
-
If you don't get the results you expected, you can click the "Back to your question" button, and rephrase the question
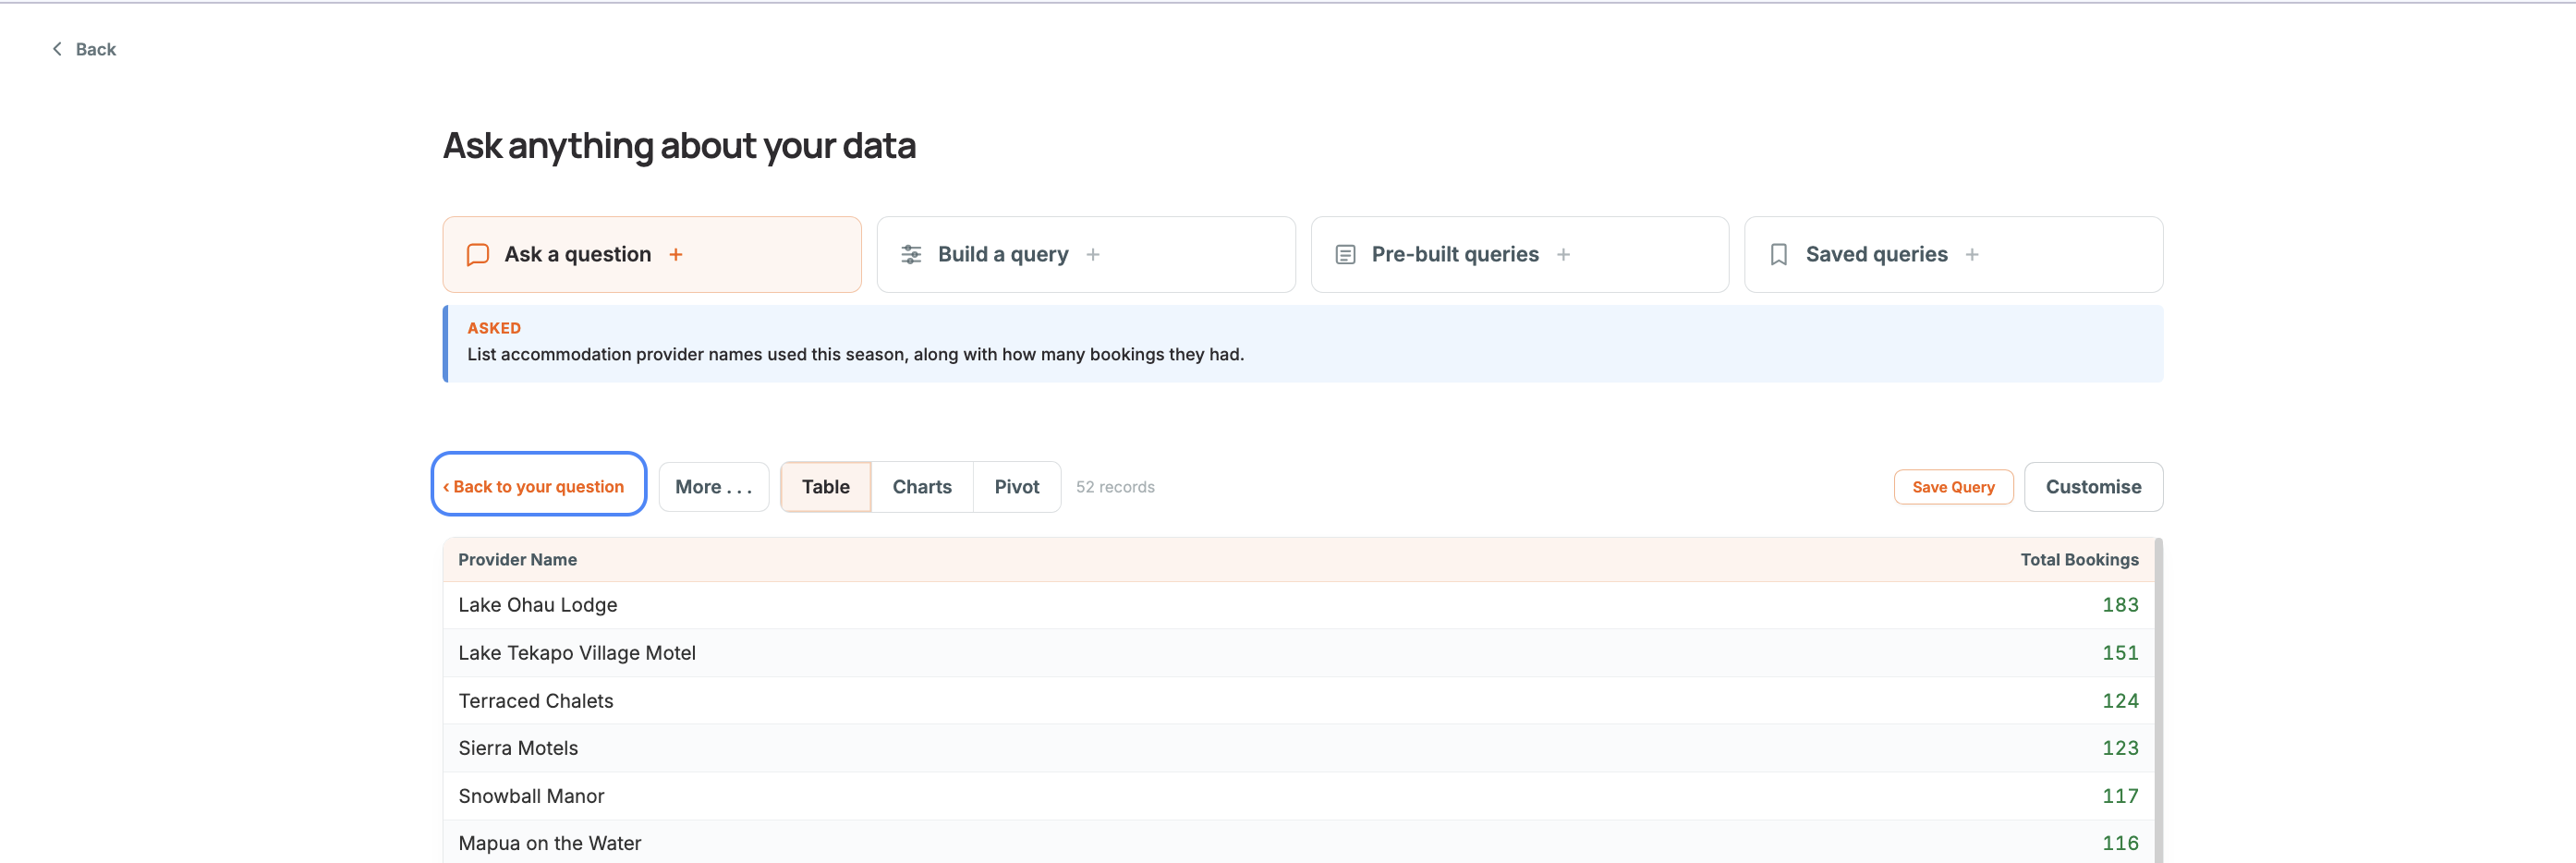
Go back to your question to rephrase it, if required 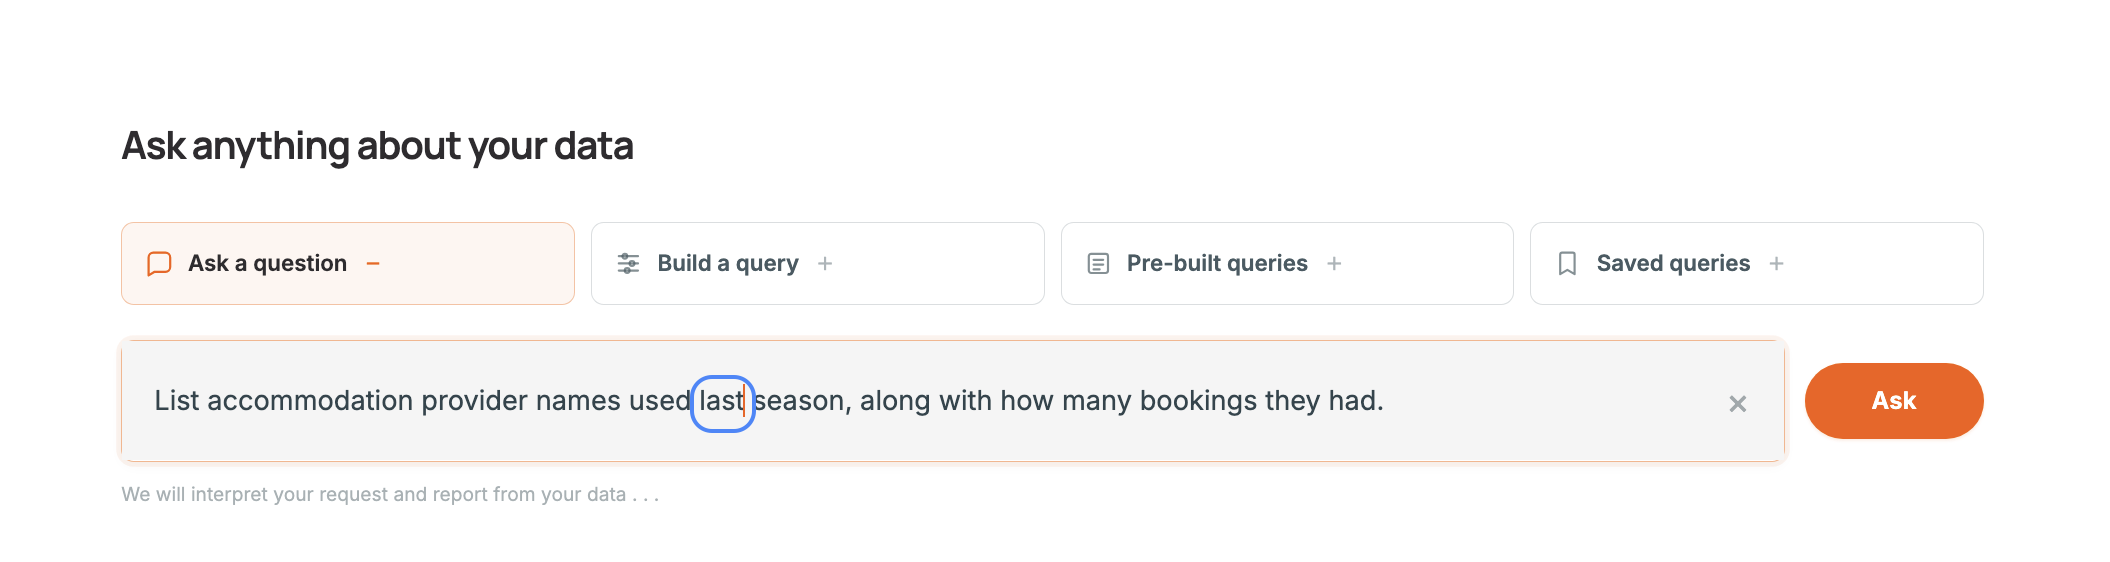
Editing your previous query
- Click the Ask button again, and your search query will be updated
These search results can be:
Build a Query
If you prefer to build your own query using some defined choices, use the Build a Query button.
- From the Main Menu | AI Reporting | Build a Query tab

- Select from one of the following options to begin to define your query
- Bookings
- Departures (or Tours)
- Clients
- Revenue
- Suppliers
- Let's take Departures (or Tours) as an example:
- Follow the prompts that are given, e.g. choosing
- What do you want to know (How many Tours, Total Pax, List the tours, etc)
- For what time period
- Filter by...
- Status
- Break it down by...
- Display option

- Once you have made your selections, you are able to edit them, if required
- Click the Run button when you have made your selections

- Your report appears

These search results can be:
PreBuilt Queries
We also offer a range of rebuilt queries for you to explore, and you can then modify these to suit your own internal requirements.
- From the Main Menu | AI Reporting | PreBuilt queries tab

- There are various categories of pre-built reports, including:
- Bookings
- Departures
- Accommodation
- Bikes
- Agents and Contacts
- Meals and Activities
- Transport and Movements
- Revenue and Finance
- Comparisons
- Operations and Capacity
- Payments and Balances
- Itineraries and Trip Masters
- Staff and Drivers
- Bike Details
- Provider Analysis
- Movements and Logistics
- Cross Table Analysis
- As an example, we have chosen "Top Agents by bookings this season, showing booking count, total pax, total revenue, average booking value, sorted by bookings descending " from the Agents section:

These search results can be:
Customising
After any query has been generated, it can be highly customised so that it meets the needs of your business.
In this example, we are going to take the PreBuilt query, "Compare bookings by month, current season vs last season"
Here is the result, but we want to define it a little more, to include another column for the Trail.

- Click on the Customise button
- Customisation can encompass a range of options, each of which has a wide range of criteria to choose from:
- Add Columns

- Sub Summary

- Sort Order

- Filters

- If you have a filter selected, an orange dot will indicate that your data is currently being filtered
- Report Output

- Report Header

- In our example, we wish to add another column:
- Click the Add Columns button
- Make a selection, or multiple selections from the Add columns options to include more fields in your query, by clicking on the + sign beside each option, so that it becomes a √
- We chose to add the Trail Code field to a column in our query
- When you have finished making selections, click the x at the top of the customisation list, to return to your report

- The new column/s are on the right hand side of your report, and can now be dragged into any new position on the report

Sorting and Filtering
Refine your report even more by filtering and sorting, to provide you with exactly the information you are seeking.
Sorting
Sorting data is the process of arranging information in a specific, meaningful order. It makes the data easier to read, search, and analyse. You can sort items from smallest to largest, largest to smallest, or alphabetically from A to Z.
- With your AI report open, click on the up or down arrow buttons which will appear beside the heading of the column you wish to sort, when you hover over it
- Hover text over each arrow will show you that you are either choosing ascending, or descending order


- You can also sort your data by using the Customise option, and selecting from the list of options available

Filtering
Filtering your data allows you to keep the important information you need, and hides or deletes the extra, wrong, or unwanted details.
- With your AI report open, click on the funnel shaped button which will appear beside the heading of the column you wish to filter when you hover over it
- A list of the values in this column will appear; click on the tickboxes of the values you wish to hide, so that there is no tick. Here, we want the report to only show records for the A2O trail, and hide the values for GTT and LR trails.

- Only values which have a tick on them will now show in your report

- You can also filter your data much more extensively, by using the Customise option, and selecting from the range of options available

Saved Queries
Any report that you have built can be saved, so that you can run it again.
To save any query, regardless of whether you used the Ask a Question option, Build a Query Option, or Prebuilt queries:
- click the Save Query button

- You will be prompted to name your saved query

- Your query is now available to be run again any time

Outputs
Odyssey's AI reporting tools enable you to produce a range of outputs in different formats, including:
- Tables

- Charts

- Pivots

Here, we dragged the Trail code to the Rows area, and the Month figures to the Column headings, to change the layout of the report


- And also the ability to export and save the data in a range of formats
- From your AI generated report, click the More... button
- choose from the following range of options:

-
Export PDF
Export Excel
Export CSV
- If you select Export CSV, you will be prompted to click the button to download the file:

- The file will appear in your downloads. To learn more about managing .csv files, click here
- Copy
- Clicking the Copy button will automatically copy all of the rows in your report to your clipboard, so that you can Paste it into an app of your choosing.
